
RShiny Showcase
I developed below tools as a helper for the project meetings or reporting. The tools are located in a private server that I developed for research purposes. I used RShiny to develop these tools. PostgreSQL database and Apache2 or NGINX web servers are used at the backend.
Sample Traffic:
This project was about investigating relationship between driving patterns and traffic safety using smartphone GPS data. I developed the tool for data exploration purposes. This anonymous GPS data provided by a third party company. The tool that I developed contains 3 tabs:
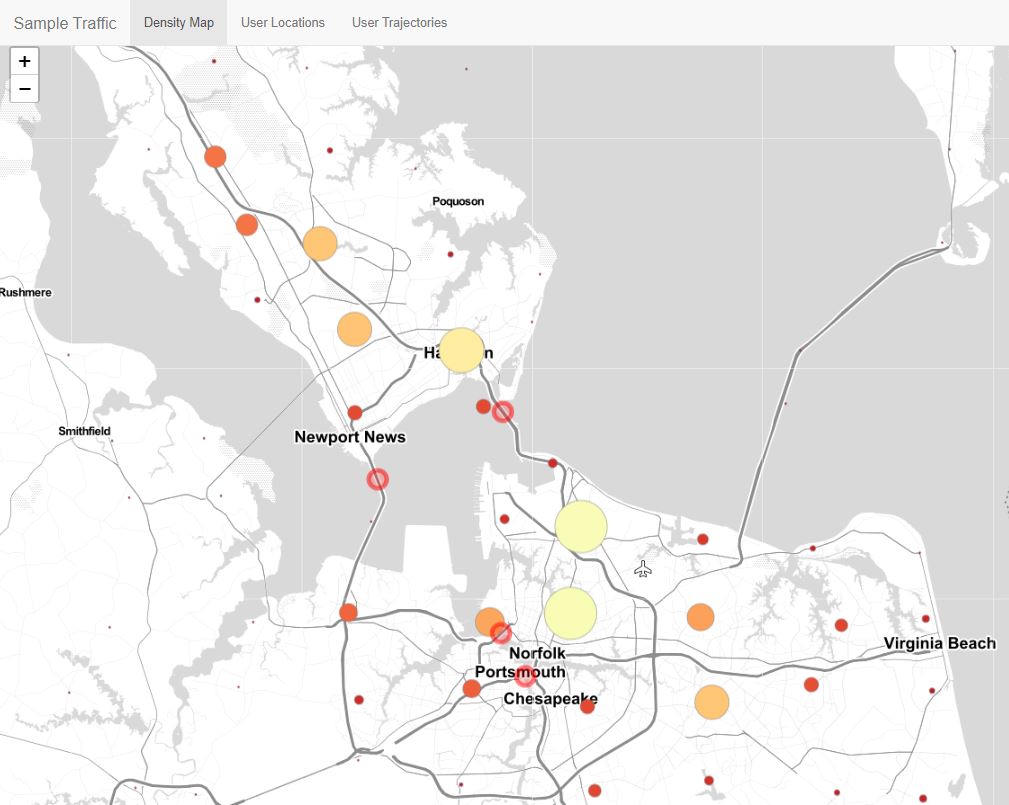
- Density Map: I created a 10x10 grid on the Hampton Roads area and count how many users pass through that grid. The size of the circles shows the density of where GPS data collected.
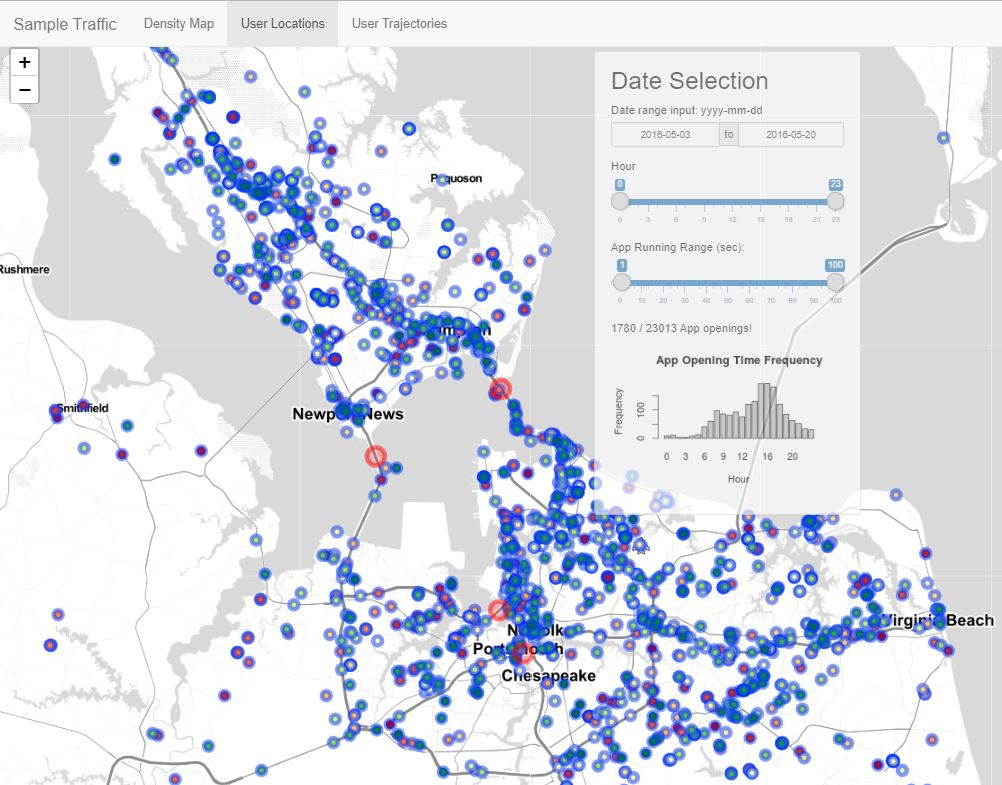
- User Locations: This map shows where the user opened the smartphone app. If you click on a marker on the map, you can see the anonymous information about the user and distance to major tunnels in the Hampton Roads area.
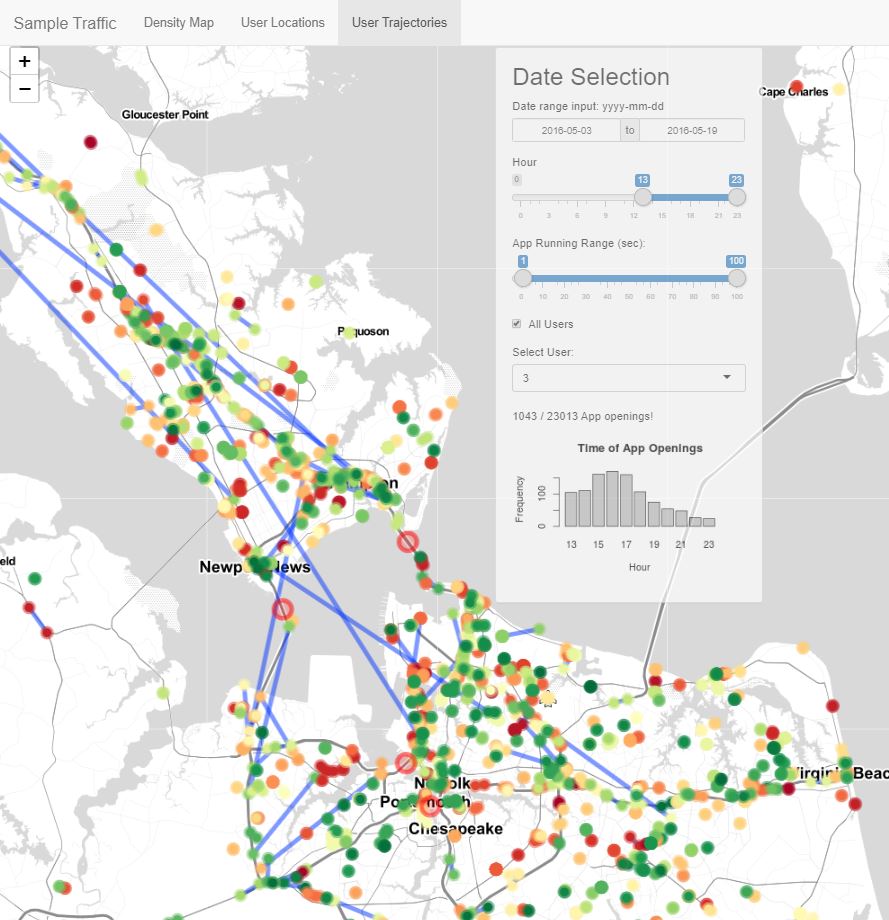
- User Trajectories: This map has same logic as user locations but it shows the where the app opened and closed with a polyline.
Overheight Trucks:
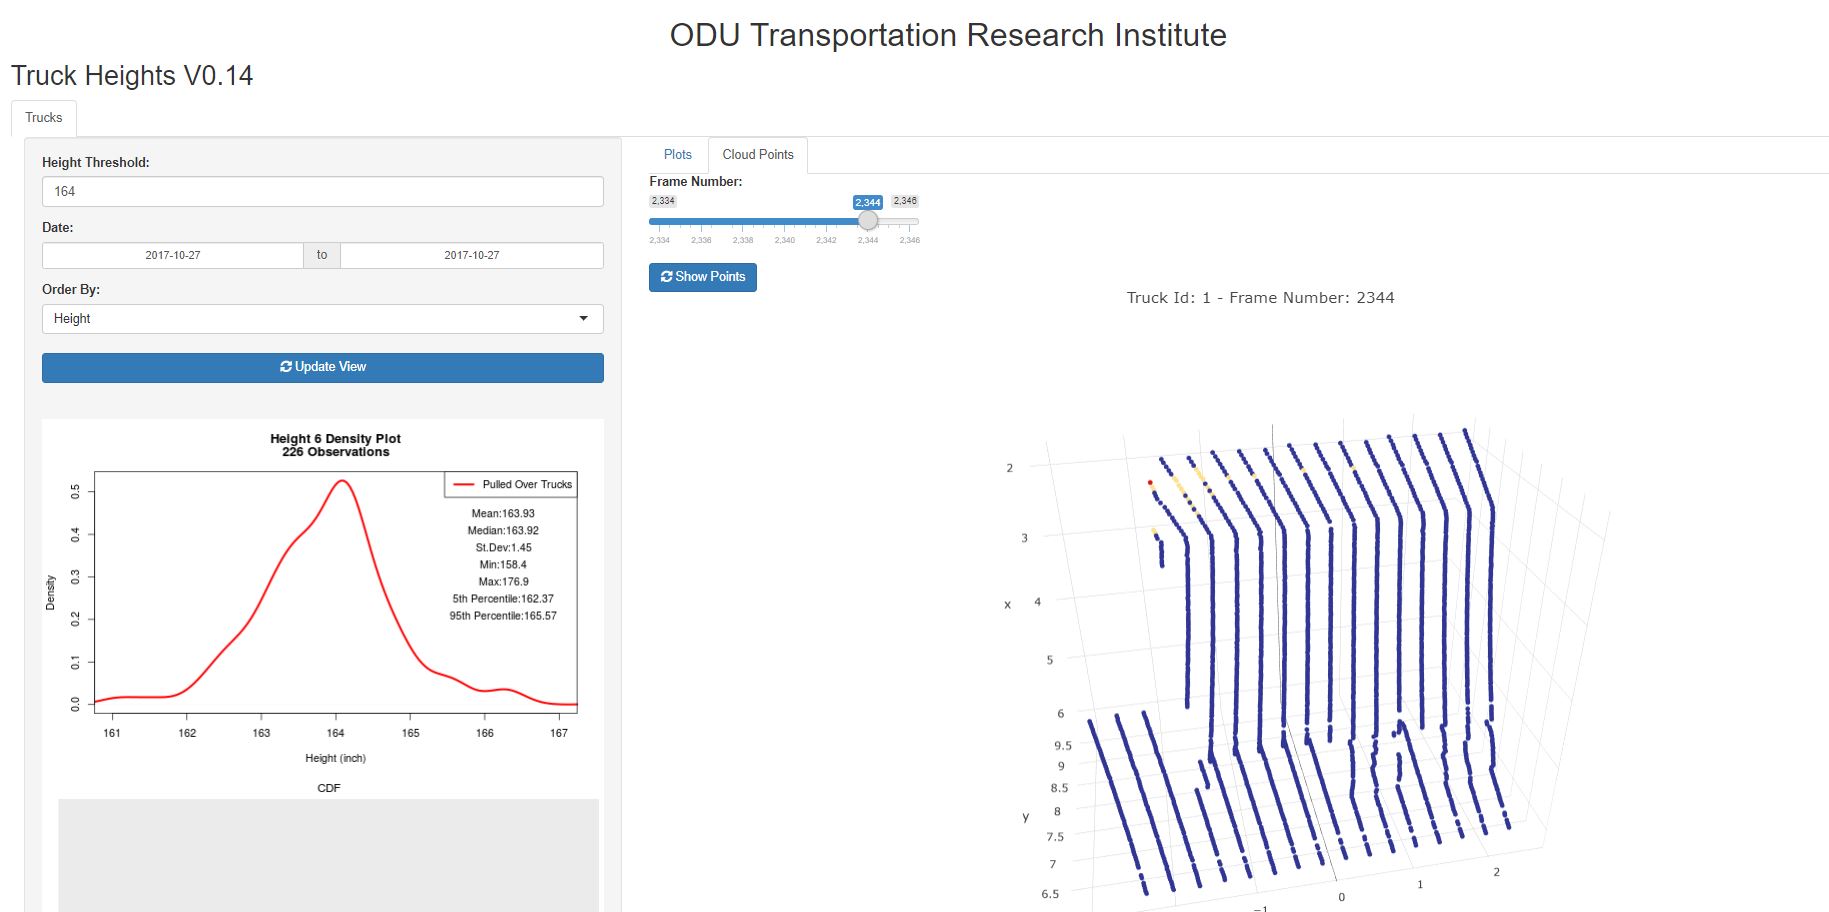
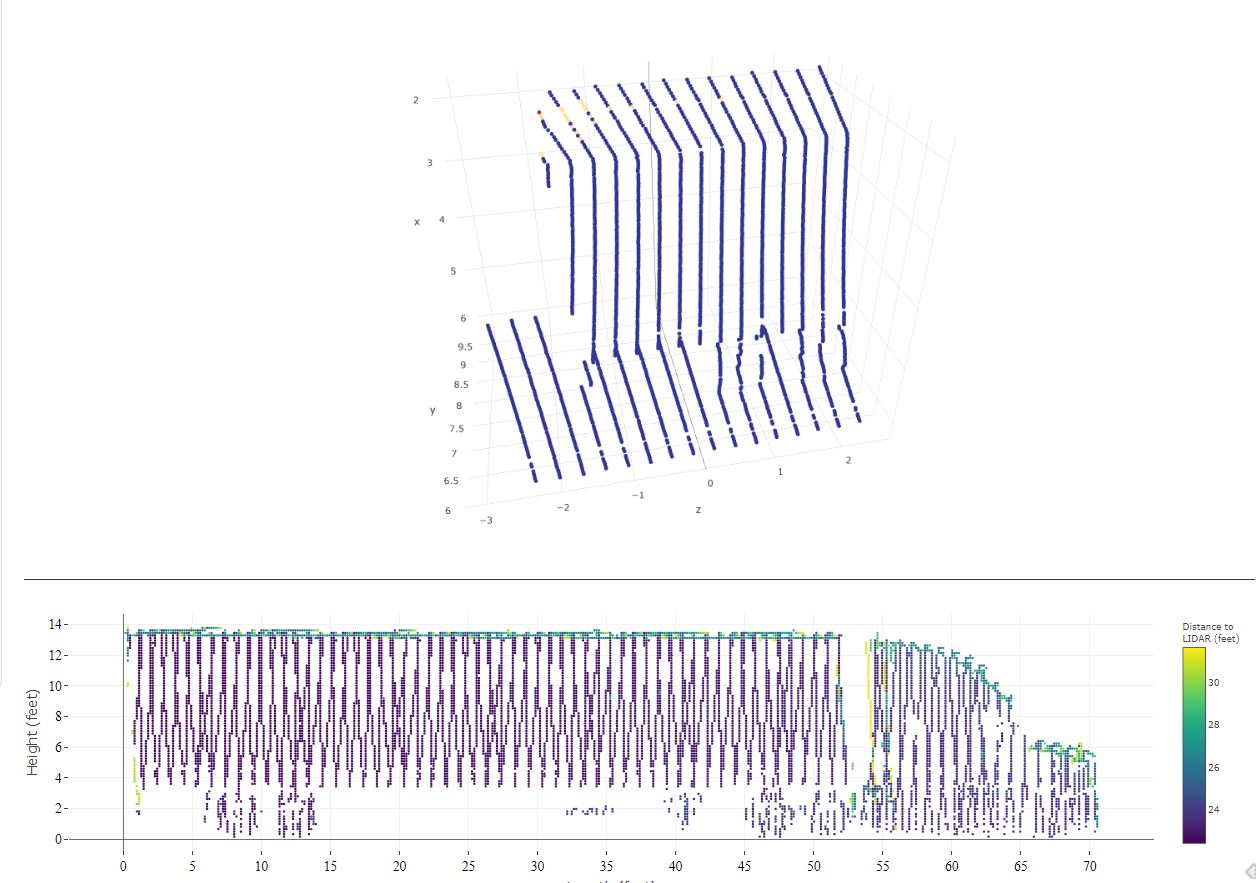
This project was about the evaluation of strategies to reduce truck turnarounds at the Hampton Roads Bridge Tunnel (HRBT). We installed a LIDAR scanner along with the surveillance cameras 1 mile before the tunnel entrance where VDOT over height beam sensor is located. We collected data for 36 days and analyzed the overheight trucks. In order to see the individual trucks video and LiDAR data I developed this interactive tool using RShiny. The tool contains many features:
- On the left panel you can filter the data by height and day and order by time or height. There is also some statistical information about the trucks.
-
On the main panel there are 2 tabs.
2.1 Plot: You will see interactive bar plots that you can zoom in and out. Each bar is a truck. When you zoom in on the top of the bar you will see some information about the truck and link for the video of that truck.
2.2 Cloud Points: When you click on a bar in the bar plot, if the bar color is change, LIDAR cloud point will be activated in this tab. You should click on the “Show Points” button to see the 3D cloud points of that truck and merged 2D points for truck profile.

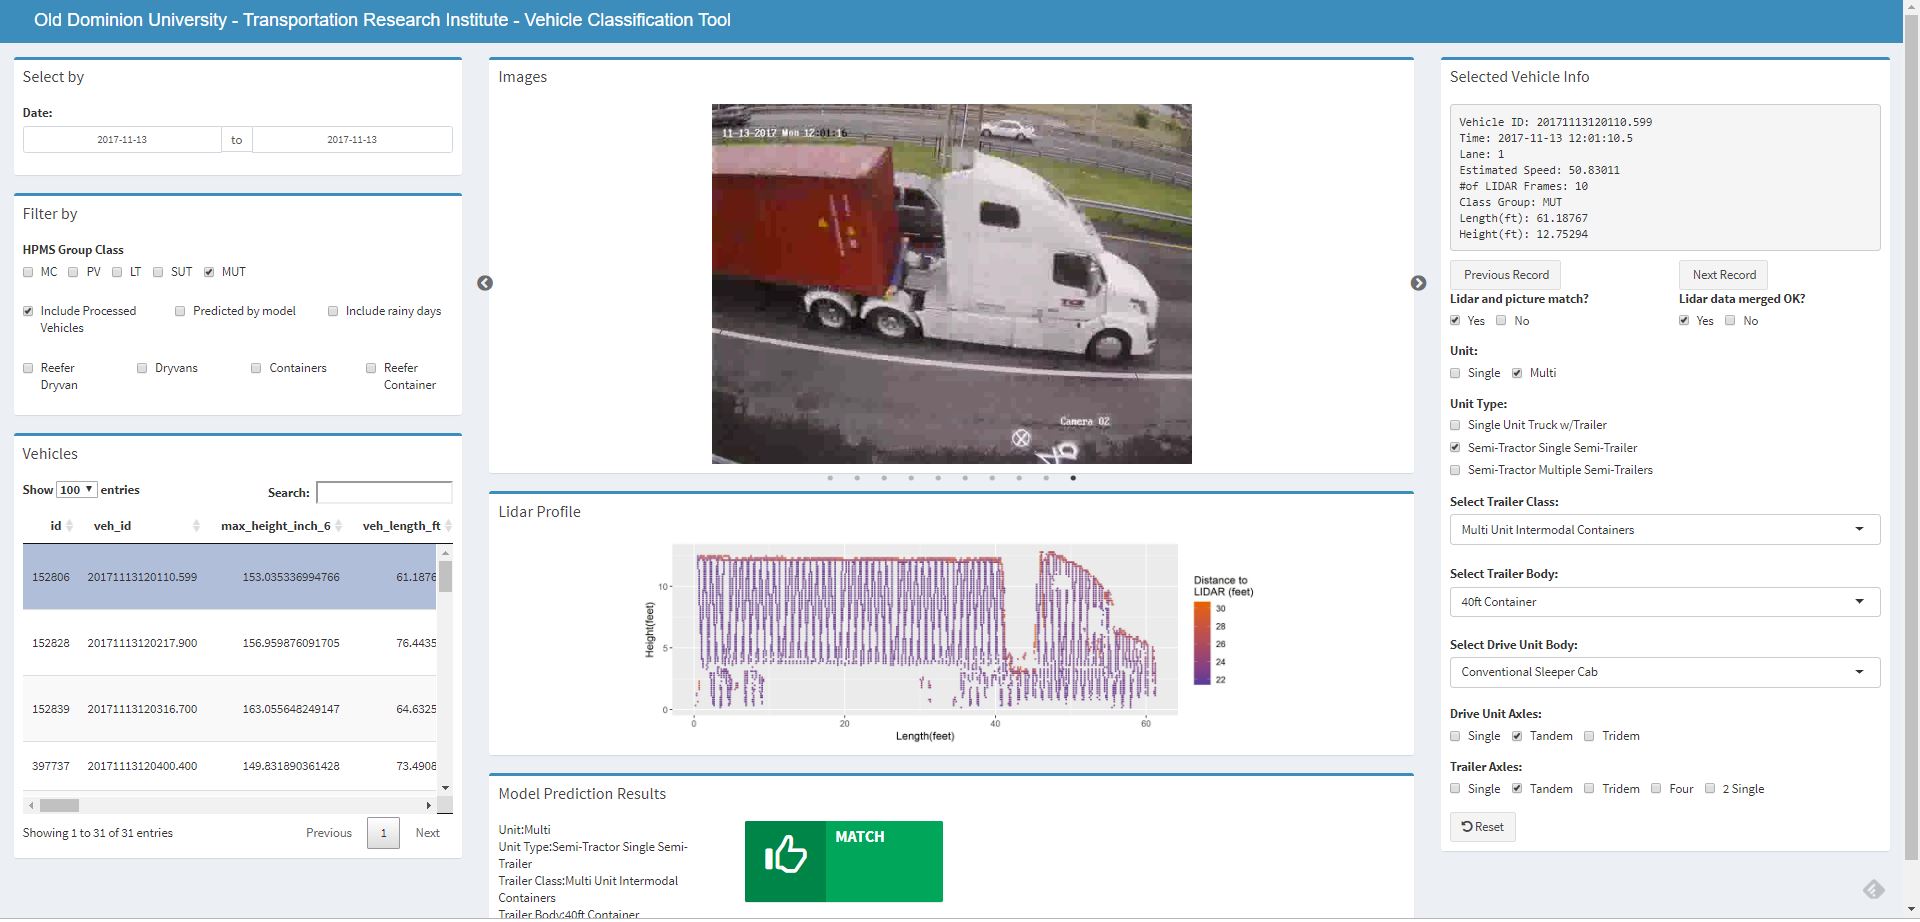
Vehicle Classification Tool:
I developed a tool that ability to see each vehicle picture and lidar data. I developed an algorithm to extract images of the vehicle while in the LIDAR view area and also I developed an algorithm to merge each individual scan of lidar data for a single vehicle. This tool also contains many features:
- Left panel contains data selection and filtration.
- Middle panel contains vehicle picture and lidar points of that vehicle.
- Right panel contains selected vehicle information and editable vehicle characteristics.
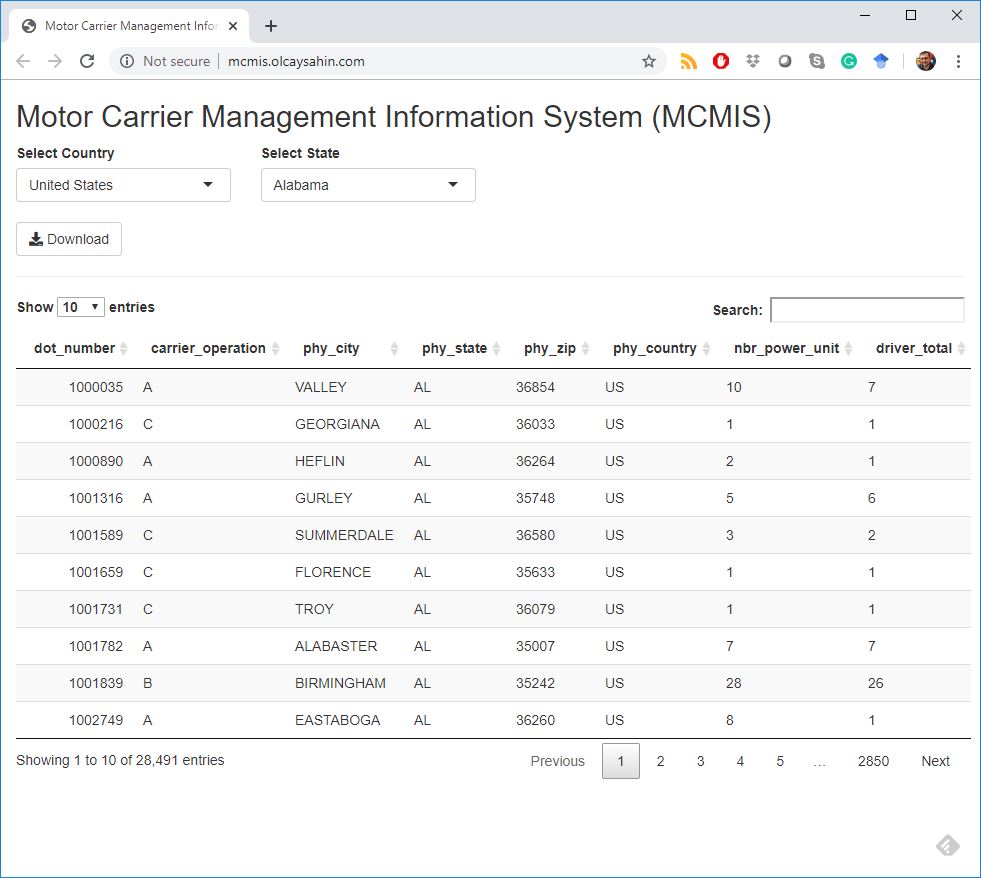
Motor Carrier Management Information System:
RShiny application for downloading and visualizing Motor Carrier Management Information System (MCMIS) data. More information can be found here: link
This application can be seen under my porfolio’s subdomain as: http://mcmis.olcaysahin.com
Disclaimer: These tools originally developed by me (Olcay Sahin) and they used for reporting and data analysis purposes. Contain of the tools cannot be copied or used other than review purposes except MCMIS.